Agreed measures
Define calculations, date ranges, exclusions and owners before chart design.

A business dashboard brings selected operational measures into one view so people can decide what to do next. We connect approved data sources, define each measure and build filters, trends and exception views around the decisions the dashboard must support.
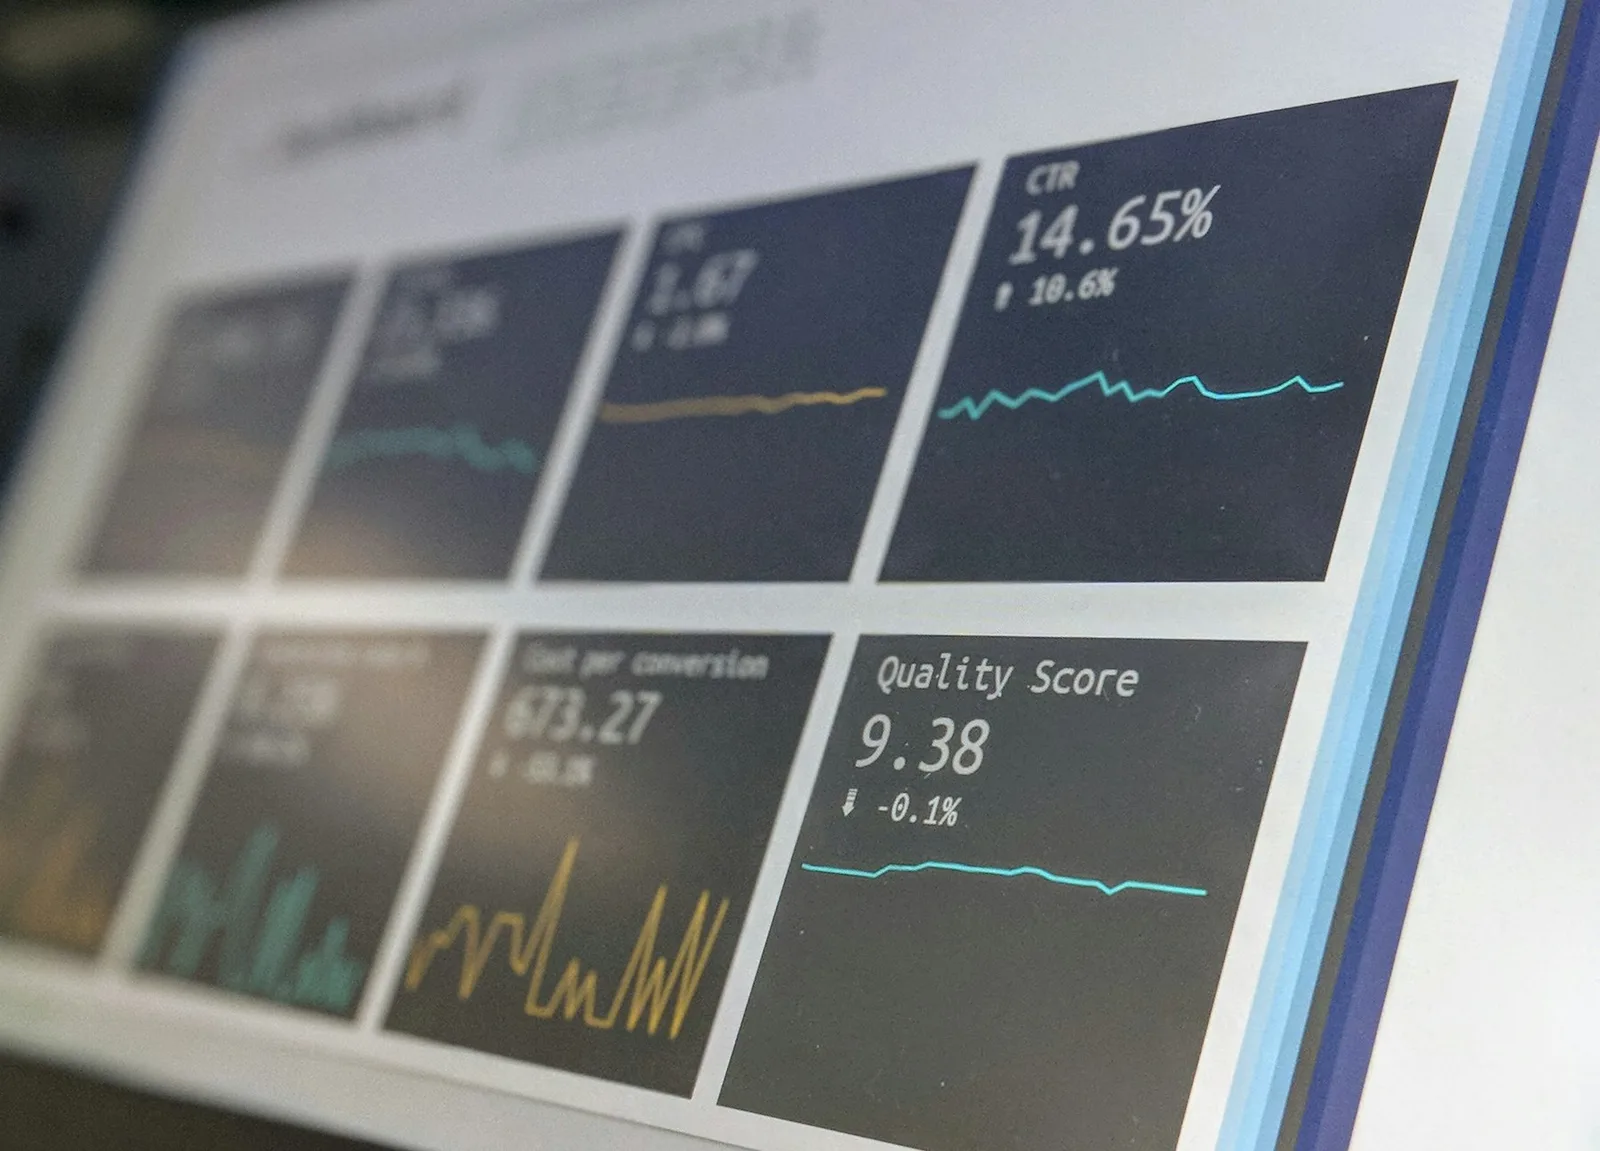
For managers comparing separate reports or struggling to identify overdue work, stock issues, sales patterns or service bottlenecks.
Define calculations, date ranges, exclusions and owners before chart design.
Read from supported sources with an agreed refresh schedule and access model.
Filter by location, period or responsibility and trace a figure back to relevant records where supported.
Highlight the operational condition requiring attention rather than displaying charts without an action.
A distributor could see overdue fulfilment by warehouse, inspect the affected orders and distinguish missing stock from an unconfirmed dispatch.
This describes a possible scope, not a claimed client result.A metric dictionary, source mappings, dashboard views, reconciliation checks and user handover. Forecasting or real-time refresh needs specific data and performance requirements.
A report in the existing platform or a configured BI tool may be sufficient. Custom dashboards are useful when decisions depend on several systems or specialised workflows.
For a Saudi team, define the required languages, authorised users, business entities and systems for the first workflow. Keep operational scope separate from any sector or finance obligations that require qualified review and current official guidance.
Optimal Designz is operated by Optimal Design Solutions SMC-PVT Ltd., registered in Pakistan. Delivery arrangements, supported languages, system compatibility and ongoing support are confirmed in the written scope; this country edition does not imply a local office.
Have a similar task in mind? Share your current tools, the people involved and one complete example.
Discuss this requirementWe identify decisions the dashboard should support, validate data sources, define metrics, design views and test the numbers against source systems.
Start with a question such as which products need replenishment or which invoices need follow-up. Identify the source, refresh expectation and owner of each measure.
Start with the decisions people need to make, then choose measures that help.
Document how totals, time periods, statuses and exceptions are calculated.
Identify the originating systems, data owners and acceptable update timing.
Show people the relevant level of detail without exposing unnecessary records.
Make changes and unusual values easier to investigate rather than hiding them.
Validate figures with users who understand the underlying business process.
We identify decisions the dashboard should support, validate data sources, define metrics, design views and test the numbers against source systems.
Agree where information originates, which system can change it and how updates or failures are handled. A focused integration or configuration may be more suitable than replacing working tools.
Separate SAR values, other currencies, legal entities and branch reporting periods. Reconcile totals with source records before presenting a consolidated performance view.
Existing software, configuration and integration are considered alongside bespoke development.
Explore the supporting detail after reviewing the capabilities and project choices.
Bring the information behind a management decision together for your Saudi business, with clear definitions and visible data freshness.
Start with a question such as which products need replenishment or which invoices need follow-up. Identify the source, refresh expectation and owner of each measure.
Ask which decisions a manager makes each week and what information would change those decisions. Define each metric, its calculation, reporting period and source. A small dashboard with trusted definitions is often more useful than many attractive charts showing figures no one can reconcile.
If data arrives from multiple systems, record refresh times, missing fields and discrepancies. Distinguish actual figures from estimates, and allow users to see the records behind a total where appropriate. Permissions matter when individual staff, customer or financial information appears in management reporting.
Management reporting dashboards should answer specific operational questions, not simply collect as many charts as possible. KPI reporting software depends on agreed definitions, reporting periods and trustworthy sources. Business dashboard development therefore starts with the decisions different users need to make and which records can support them. Business intelligence dashboards may combine information from multiple systems, but discrepancies and refresh schedules must be clear. Data visualisation solutions should make context, units and limitations visible, especially where numbers are estimated. For custom business dashboards projects in Saudi Arabia, we verify the data model and review example decisions before designing the finished view.
Practical answers to help you compare options and prepare for a useful project conversation.
For managers comparing separate reports or struggling to identify overdue work, stock issues, sales patterns or service bottlenecks.
A business dashboard brings selected operational measures into one view so people can decide what to do next. We connect approved data sources, define each measure and build filters, trends and exception views around the decisions the dashboard must support.
It combines selected data into views designed for specific decisions. The first step is agreeing what each metric means, where it comes from and how current it needs to be.
A management dashboard may focus on a few recurring decisions, while business intelligence dashboards can support broader exploration and analysis. Both need reliable definitions and data sources.
Sometimes, using exports, APIs or a suitable data layer. Cross-platform totals require reconciliation before they can be presented as dependable figures.
Not necessarily. Real-time information adds complexity and cost; daily or hourly updates may be adequate for many decisions. Choose frequency according to operational need.
Show clear dates, data sources, units and definitions. Distinguish gross and net figures, forecasts and actuals, and incomplete data from confirmed results.
They can, if metrics have consistent definitions and permissions limit access appropriately. Comparing branches with different operating models may require context.
The main cost factors are user roles, complete workflows, system interfaces, migration and acceptance testing. Compare a focused first release with a wider build, and separate development from hosting, provider licences, usage and support. Share one representative task and your current systems so the estimate can state deliverables, assumptions and exclusions.
Reconcile sample numbers to their source systems, check filters and date ranges, validate access permissions and confirm that decision-makers understand what the charts represent.
Choose a decision before choosing charts: replenishing stock, reviewing overdue invoices or understanding enquiry quality. Define each measure, source and refresh expectation. Share the systems involved, representative examples and the decision-makers who can review the work.
Separate reporting by branch, entity and currency where needed. A combined total is useful only when time periods, conversions and access permissions have been agreed. The supported languages, interfaces and rollout arrangements are confirmed in the agreed scope.
Start with a question such as which products need replenishment or which invoices need follow-up. Identify the source, refresh expectation and owner of each measure. Share the systems involved, sample records and the people authorised to review the work.
Separate SAR values, other currencies, legal entities and branch reporting periods. Reconcile totals with source records before presenting a consolidated performance view. Scope, translation, access, delivery and support responsibilities are agreed before development.
Share your Saudi business workflow, the systems you use today and the outcome you want to explore. We’ll agree the scope, dependencies and useful next step.
May we use Google Analytics to understand website visits and completed enquiries? It’s optional, and you can change your choice at any time.
Cookie information